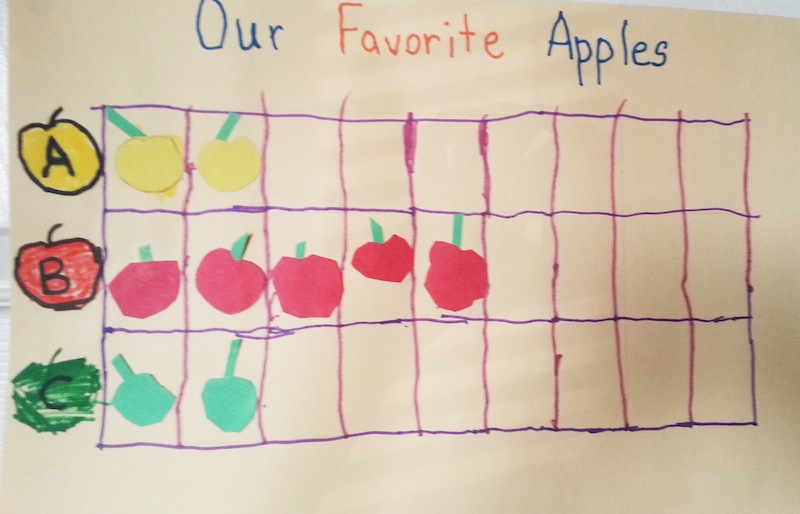
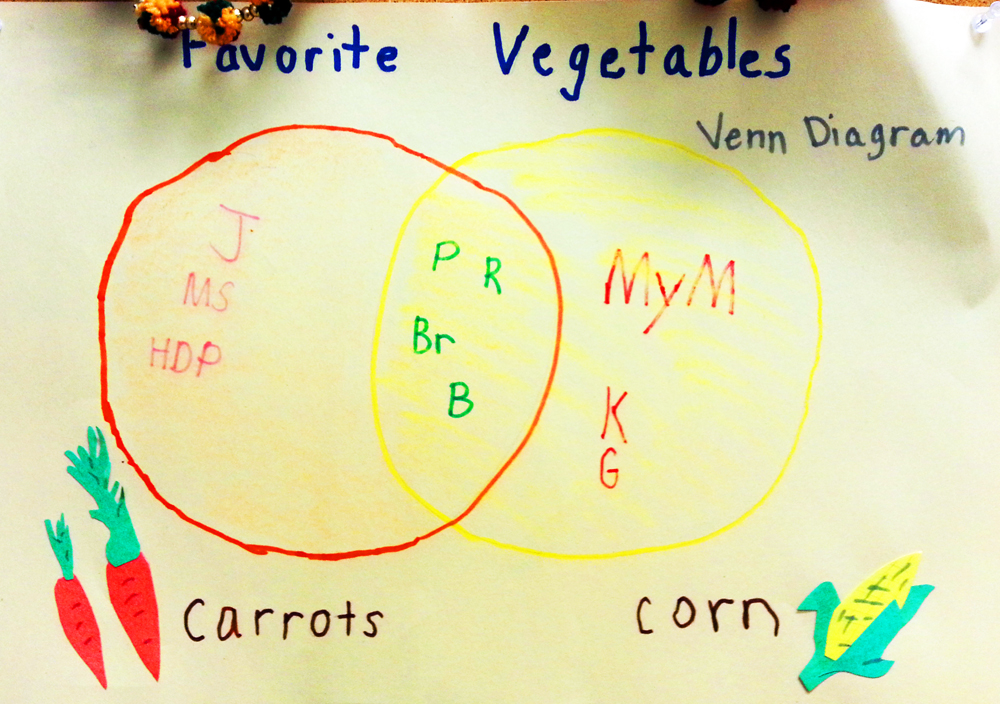
What are those fancy visual aides? We see them in many places. They help us to better understand information and to display it in more impactful ways when we are the ones presenting it. BUT … that’s only if you know how to read them and/or make them. Graphs and Venn Diagrams are two wonderful visual aides which we are learning to read and create. After sufficient instruction and practice at extracting information from them, the students learn to make their own: first deciding which one best serves the purpose, next collecting the required info.; afterwards placing it into the desired format. Finally, it is displayed for all.
Venn Diagrams and Graphs of Favorites